Howto: DTP Dilemma (Amiga Computing 89 August 1995)
There comes a time in everybody’s life when, despite their best efforts to avoid such a thing, they find themselves needing to do something horrendous such as producing a (dare I say it) graph or, even worse, a mathematical formula.
The Amiga, despite having excellent DTP and document processing packages is rather devoid of this sort of tool. What options are there available to the frustrated user?
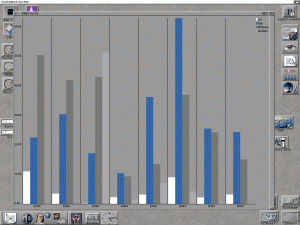
Well, a simple bar chart (or histogram) can be knocked up in a suitable paint package; however, it is a shame when you’ve got a 300 DPI printer sitting on your desk to print out a graphic that was designed for display on a 70 (ish) DPI monitor. Saying this, you’ll be fine as long as you don’t need any lines which aren’t horizontal or vertical…
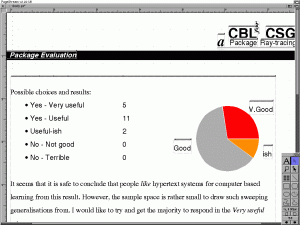
What about a pie chart? The mathematically minded could convert an angle to a co-ordinate on a circle but what if you haven’t got the time or inclination to do this? There’s a fair whack of processing power at your fingertips and you’ll be reduced to using it as a calculator. Shame really.
As for presenting three dimensional data, such as sales of different items over a set of months: euurgh. Practically impossible to do manually.
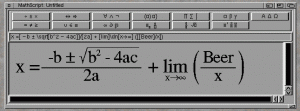
Worse still, entering a mathematical equation. Consider the solution of a quadratic equation: x = (-b (+ or -) sqrt(b≤ – 4AC) / 2A)
It looks a lot better when presented in its original form. The paint package of your choice could be the only way out, or you could try and draw something with a DTP package which would (and I speak from experience here) look like the cat had done something unsavory on your page.
It’s depressing to go and use Word on a PC – these things are built in! As good as Final Writer or WordWorth are, they are still missing these things.
However, there are cheap (nay free) solutions thanks to the Amiga’s superlative public domain and shareware fraternity and, in the politically correct 90s, sorority.
First off, this data that you want to do something with, preferably graph it and save the graph as an IFF DR2D (IFF’s structured drawing format) or EPS (Encapsulated PostScript) file. The choice as to which to use will be dictated by your package: PageStream likes IFF DR2D if you’re printing on a non-postscript printer whereas Final Writer likes EPS for anything.
There’s quite a few packages that claim to do this sort of thing. However, the best and most flexible that I have found are JCGraph and AGraph which are both PD and, curiously enough, both written by Francophonic authors – JCGraph is from Canada and AGraph comes from France. I have yet to draw conclusions from this observation.
AGraph has only recently been written by Denis Gounelle and produces a variety of graphs (including Histogram and pie char) which are output as an IFF bitmap corresponding to the size of the window. Data is read from a text file which gives information on the sort of graph to draw, number of colours to use and the actual data to display.
The manual (which is provided in both English and French) gives a lot of good, easy to read information on how to produce a data file. The format of the file is sensible and easy to remember.
One thing that would be exceptionally useful for this package would be an option to specify what size in pixels to make the output. Who knows – The author may include it in the next version.
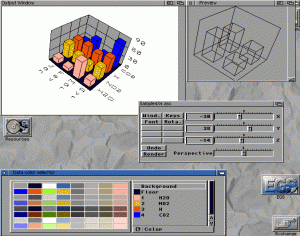
The most feature packed software that I found for the task of displaying data was the JCGraph package. Flexibility is paramount with this package; graphs can be made in 13 two dimensional or 13 three dimensional formats, colours or grey scale values can be set, as can labelling size and oodles more.
The resulting graph can be saved in DR2D, ILBM, EPSF (grey or colour), GEO or DRAW2000 format – at least one of those should work with the package of your choice.
Again, data is written into a text file then loaded into the package. There are a couple of bijou quirkettes in the data format: for example, the number 1003 must start off every data file for JC Graph. Why not the word JCGraph? Who knows…
Following this is the size of the data array – this specifies the arrangement of data. Four values plotted over twelve months would be a four by twelve array, requiring 48 data entries.
Another strangitude that manifests itself is the “cotation” scale and multiplier values that have to be in the data file. I seem to recall that this is something to do with height from my French, so I guess it’s the height scale and multiplier. It’s worth mentioning that the manual is again provided in French and English, but the English can be hazy at times.
After this, the actual data comes followed up by the row (and column, if three dimensional) names.
It’s a bit of a fiddle to enter the data and the chances are that rows and columns will be entered in the wrong order for the first few tries but eventually good results can be obtained.
Once the data file is prepared, this is loaded into the program. Then the type of graph to draw is selected from any one of the thirteen different types.
The rotation of the graph, along with perspective, can be changed through the use of sliders. A preview window updates to show a sample of the graph type in the orientation that you have selected.
Once everything is fine and dandy, click on the render button which will render the graph to fill the final output window no matter what its size. If the graph’s appearance meets your requirements, you can save it in any one of the formats listed before to wherever takes your fancy.
The package has a complete AREXX port too, should you wish to automate your graph creation. There’s also a brief description of how to create your own graph types should you wish to make a completely different graph with whatever properties you require.
The author of JCGraph has unfortunately stopped developing the package which is a shame. There’s a few bugs like it not liking more than 16 colours on screen, and the manual really could do with a few updates. However, for free I don’t suppose we can complain but be thankful that it does what it does so well.
All in all, I reckon that JCGraph is quite easy to use, feature packed and well thought out – certainly worth having in anyone’s suite of document processing tools as you never know when you may just need it.
And so we move swiftly onto the other frequently met problem – how to insert something looking like a mathematical equation into your documents.
For quite a few years a typesetting language called “Tex” (pronounced tech for no adequately explained reason) has been available to perform this very task, and there is an Amiga port of the beast. However, it’s not everyone’s cup of tea as the term WYSIWYG was not heard of when the language was conceived – this doesn’t detract from the power of the language though. The whole idea of Tex is to abstract the formatting away from the user so as to produce good looking, readable documents without having to worry about layout.
The Amiga version, called Pastex, is free and good. However, this is not really the solution that most people will want especially as many only want a quick equation now and then.
A few weeks ago, a package called MathScript version 2.0 was uploaded to Aminet by its author, Simon Ihmig. Curiosity got the better of me, and I downloaded.
The first thing to say is, “This package is a stormer!” It really is excellent. The author appears to have produced the package for the reasons that it was needed and as an exercise in programming. It’s difficult to get excited about this sort of thing but it really is that good.
I’ll stop prevaricating about the bush and tell you what it actually does. Double clicking on the package’s icon gives a rather nice interface built using Magic User Interface, therefore allowing the look of the package to be completely altered, should the urge take you.
Residing at the top of the window is a bank of thirteen buttons, each of which bring up a different array of symbols when clicked on. Below this is a simple string gadget and then the rest of the window is taken up by an inocuous looking frame with sliders on both sides.
Mathematical equations are entered into the string gadget with special symbols fetched from the banks of symbols then the equation is previewed by clicking on the large frame.
Superscript and subscript are catered for as is all the necessary formatting that I could rack my brains to think of. The size of the font used can be set to whatever is required, too. Symbols include all standard Greek characters and more mathematical ones than my ‘umble brain could recall.
Once happy with the previewed results, they can be saved as ILBM, postscript or encapsulated postscript. EPS has a bitmap of the results inside the file as well as the postscript information; with this format, Pagestream can be coaxed into printing the results on any printer. The resolution of the preview can be set too, providing for high resolution images if needed within PageStream.
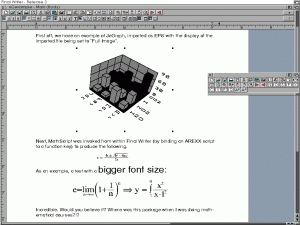
Final Writer is very much at home when dealing with EPS images, and the author provides full instructions to get the two packages behaving happily together – all that has to be done is remove a couple of comments from Final Writer’s Postscript initialisation file.
The package has a full AREXX interface and comes with three AREXX scripts – one for the package and two for use in Final Writer. All three automate the passing of formulae between the packages: InsertFormula is used from within MathScript to push the EPS result to Final Writer (using the size of the current font in Final Writer – a nice touch) whereas the other two open and close MathScript from within Final Writer.
This addition to Final Writer makes it closer to what Word is for the PC – it’s an excellent example of what the Amiga and AREXX can do.
Even if you don’t have Final Writer, this is pretty much another “must have”. It’s excellently written and does the job it is supposed to do very well. The shareware fee is $15 and my only niggle is that this has to be sent to somewhere in Germany.
The two packages that have been looked at in depth here (JcGraph and MathScript) both add to the Amiga’s DTP or document processing suite and will, for most people, be used at least once or twice.
With these two packages installed, there’s no reason to change machine as they bring all the functionality you could need to the Amiga. A big hearty “thank you” is deserved by the authors.
